Spectrum Analysis and Somerset Education Online Mapping for Schools
Spectrum Analysis and Somerset Education are proud of their on-going relationship to provide online mapping to schools through the Somerset Education Portal.
We are pleased to announce that updated information is now available through the Somerset Education Portal and Spectrum Analysis GeoMapping and GeoMapping Plus Products.
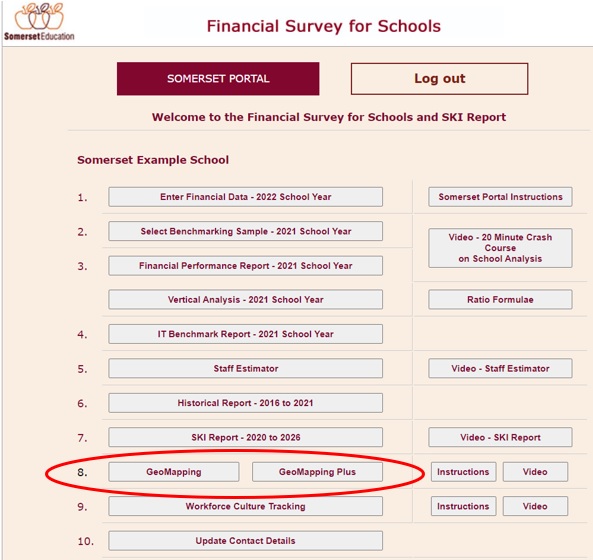
The Somerset Education Portal provides easy access to complimentary GeoMapping for participants in the annual Financial Survey for Schools (FSS).
GeoMapping Plus provides more detailed demographic analysis for a small additional fee.
The GeoMapping Plus upgrade includes additional information that schools will find valuable including:
- ACARA updates
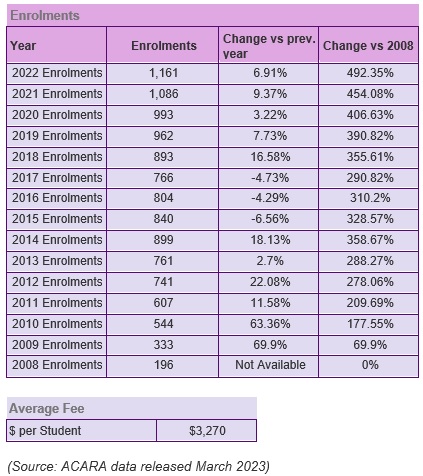
The mapping now includes the latest ACARA data with enrolment numbers up to 2022 for 9,000+ schools across Australia. The data includes teaching and non-teaching staff numbers and a comparison for each school in Student / Teaching Staff ratio. We have also added an average fee estimate based on the government data for comparison to your school and others:
Sample school in a high growth area.
• Full Time Equivalent Teaching Staff: 84.8
• Full Time Equivalent Non-Teaching Staff: 23.2
• Total Enrolments: 1161
• Girls Enrolments: 589
• Boys Enrolments: 572
• Student/Teaching Staff Ratio: 13.7 students per FTE teaching staff
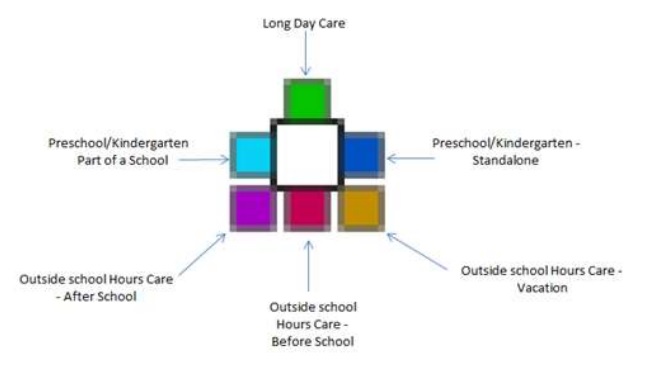
- ACECQA Child Care and Early Learning Centre ELC Data
We have added 17,000 Child Care and Early Learning Centres from Australian Children’s Education & Care Quality Authority (ACECQA) data. This can be great information for marketing your school to future Prep students.
• Service Name: Spectrum Childcare
• Provider Legal Name: Spectrum Analysis
• Service Type: Centre-Based Care
• Service Address: Suffolk Rd
• Suburb: Surry Hills
• State: NSW
• Postcode: 2199
• Phone: xxxxxxxxxx
• Email Address: spectrum@spectrumanalaysis.com.au
• Number Of Approved Places: 69
• Overall Rating: Working Towards NQS
• Long Day Care: Yes
• Preschool / Kindergarten – Part of a School: No
• Preschool / Kindergarten – Stand alone: Yes
• Outside School Hours Care – After School: Yes
• Outside School Hours Care – Before School: Yes
• Outside School Hours Care – Vacation Care: Yes
Our codes allow us to see different types of Early Learning Centres:
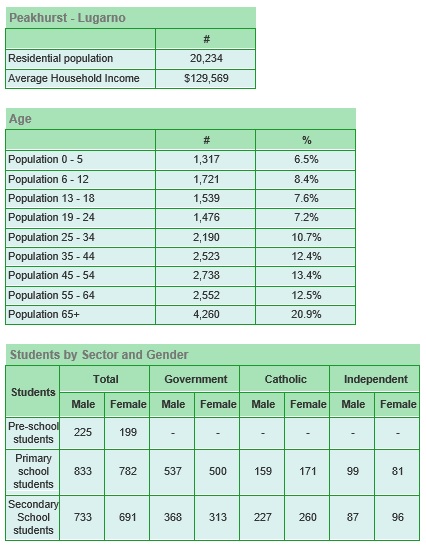
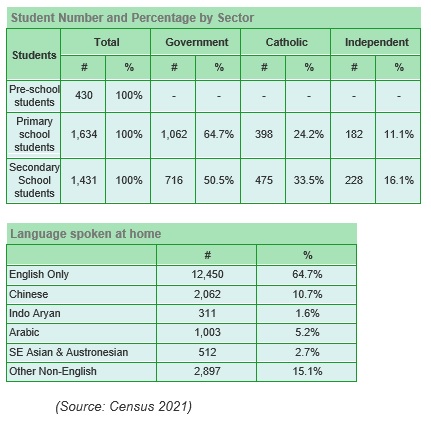
- Census 2021 and Census 2016 data for comparisons
We have now included data from the Australian Bureau of Statistics (ABS) Census 2016 and Census 2021 so you can make comparisons of information relevant to schools around population, household income and specifically about how many school age and pre-school children live in the area, and whether they go to a Government, Catholic or Independent school, and the relevant percentage. On top of this is the Language Spoken at Home for the area as an indication to the ethnicity of the area.
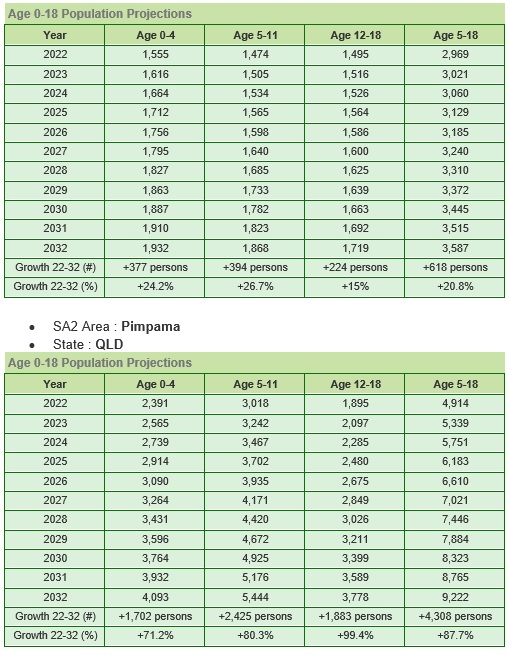
- Population forecast 2022 – 2032 from the ABS
This data gives the population estimates from the Australian Bureau of Statistics (ABS) and is prepared every five year cycle for the Department of Health to assist in placement of hospitals and medical facilities. In our view, this is the best National data that is available, and comes at Standard Area 2 (SA2) level. We have broken this down to give an estimate at Pre-school / ELC level, Primary school level and then Secondary school level, and finally for a P – 12 school. Our upgrade changes the way we see it and therefore breaks it into approximate levels. This is one of the most important layers in our mapping as it shows expected growth for every area.
• SA2 Area: Braybrook
• State: VIC
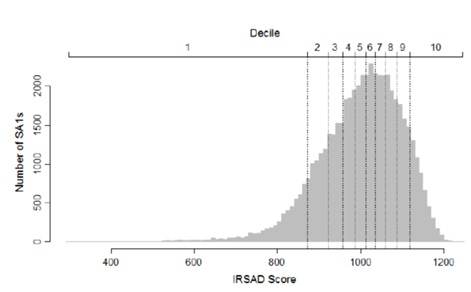
- SEIFA data – released in May 2023
The Socio Economic Index for Areas (SEIFA) has just been released and we have now updated the mapping to reflect this Australia wide.
This looks at every area in Australia to give a comparative score to assess what the residents can afford to do. The average of the SEIFA score for Australia from the 2021 census was 1004, and top areas like around Double Bay in Sydney or Toorak in Melbourne score up near 1200, and low socio-economic regional areas may drop to numbers like 600 – 800. This is a better way for comparing areas Australia wide rather than just the Average Household Income. This is one of the best indicators of the parent’s ability to pay fees.
SA2 Area: Dulwich Hill – Lewisham
Population: 17,957
SEIFA Score (Census 2021): 1,106
SA2 Area: Bondi Beach – North Bondi
Population: 20,707
SEIFA Score (Census 2021): 1,170
SA2 Area: Campbellfield – Coolaroo
Population: 16,066
SEIFA Score (Census 2021): 836
Summary
Using the Somerset Education Portal and Spectrum Analysis’ GeoMapping Plus gives you a wealth of information to assist you in making the best possible decisions for your school.
For more information, contact either John Somerset or Peter Buckingham below.
Peter Buckingham CMC, CFE, FFCA, FIMC
Co-Founder and Managing Director
Spectrum Analysis Australia
John Somerset FCA
Director
Somerset Education
Suite 6, 407 Canterbury Road, Surrey Hills, Victoria, 3127
+61 3 9830 0077 or +61 411 604 921
peterb@spectrumanalysis.com.au
spectrumanalysis.com.au
linkedin.com/in/peterbuckingham1
GPO Box 3273 Brisbane, Queensland, 4001
Telephone 1300 781 968
survey@somerseteducation.net
somerseteducation.net
linkedin.com/in/john-somerset-fca-27932028/