Individual School Enrolment Data for 2024 Now Available
Peter Buckingham BSc, GradDip (Market Modelling), CMC, CFE, FFCA, MEdPlus, WFA, ACAVic is the Co-Founder and Managing Director of Spectrum Analysis Australia Pty Ltd, the leading demographic analysis and mapping company for schools in Australia. He was also a Federal Director and Victoria / Tasmania President of the Institute of Management Consultants. Peter is contactable by email at:
peterb@spectrumanalysis.com.au or visit spectrumanalysis.com.au.
If you have access to Spectrum Analysis’s Mapping for Schools, you can now look up your own school and any school you wish (over 9,000 schools) and the data now gives you enrolment data from 2008 to 2024 inclusive.
Here’s an example:
• School Name: The King’s School
• Website: https://www.kings.edu.au
• Campus Type: School Head Campus
• School Sector: Independent
• School Type: Combined
• Full Time Equivalent Teaching Staff: 206.4
• Full Time Equivalent Non-Teaching Staff: 198.5
• Total Enrolments: 2157
• Girls Enrolments: 96
• Boys Enrolments: 2061
• Student/Teaching Staff Ratio: 10.5 students per FTE teaching staff
Enrolments
| Year | Enrolments | Change vs prev. year | Change vs 2008 |
| 2024 Enrolments | 2,157 | 0.94% | 47.94% |
| 2023 Enrolments | 2,137 | -0.14% | 46.57% |
| 2022 Enrolments | 2,140 | 4.59% | 46.78% |
| 2021 Enrolments | 2,046 | 12.17% | 40.33% |
| 2020 Enrolments | 1,824 | 2.93% | 25.1% |
| 2019 Enrolments | 1,772 | 2.07% | 21.54% |
| 2018 Enrolments | 1,736 | 3.58% | 19.07% |
| 2017 Enrolments | 1,676 | 2.76% | 14.95% |
| 2016 Enrolments | 1,631 | 2.45% | 11.87% |
| 2015 Enrolments | 1,592 | 2.12% | 9.19% |
| 2014 Enrolments | 1,559 | 2.1% | 6.93% |
| 2013 Enrolments | 1,527 | 1.13% | 4.73% |
| 2012 Enrolments | 1,510 | 0.33% | 3.57% |
| 2011 Enrolments | 1,505 | 0.4% | 3.22% |
| 2010 Enrolments | 1,499 | 2.11% | 2.81% |
| 2009 Enrolments | 1,468 | 0.69% | 0.69% |
| 2008 Enrolments | 1,458 | Not Available | 0% |
Source: ACARA data released February 2025
| Average Fee | |
| Year | Average Fee ($ per Student) |
| 2020 | $31,915 |
| 2022 | $32,724 |
Source: My School data
The 2024 ACARA Release Nationally and by State
Most of us would have heard the headlines that more students are now going to Independent schools and less are going to Government schools and you may have noticed that the media have highlighted this information.
Now that Covid is five years behind us, (even though the recently released figures were for 2024), it is interesting how with the tougher economic times that the Independent schools are still continuing to thrive!
| Australia | |||||||||
| Full Time Equivalent Enrolments | |||||||||
| 2020 | 2021 | 2022 | 2023 | 2024 | 2020 -2024 | 2021 -2024 | 2022 -2024 | 2023 -2024 | |
| Catholic | 727,666 | 736,785 | 744,061 | 755,373 | 768,352 | 5.59% | 4.28% | 3.26% | 1.72% |
| Combined | 110,878 | 117,674 | 123,947 | 130,875 | 139,354 | 25.68% | 18.42% | 12.43% | 6.48% |
| Primary | 354,970 | 354,818 | 354,710 | 356,362 | 359,494 | 1.40% | 1.45% | 1.48% | 1.01% |
| Secondary | 258,830 | 261,159 | 262,129 | 264,530 | 264,864 | 2.32% | 1.41% | 1.04% | 0.12% |
| Special | 2,989 | 3,133 | 3,275 | 3,606 | 4,202 | 40.59% | 34.12% | 28.28% | 16.53% |
| Govnmnt | 2,643,597 | 2,637,137 | 2,619,520 | 2,627,224 | 2,632,284 | -0.43% | -0.18% | 0.49% | 0.19% |
| Combined | 196,476 | 197,882 | 200,975 | 201,675 | 200,818 | -2.21% | 1.48% | -0.08% | -0.43% |
| Primary | 1,500,380 | 1,487,327 | 1,457,758 | 1,457,005 | 1,452,635 | -3.18% | -2.33% | -0.35% | -0.30% |
| Secondary | 913,442 | 918,295 | 925,728 | 941,153 | 948,612 | 3.03% | 2.49% | 1.67% | 0.95% |
| Special | 33,299 | 33,632 | 35,059 | 36,218 | 37,678 | 13.15% | 12.03% | 7.47% | 4.03% |
| Indepdnt | 647,214 | 669,203 | 690,734 | 716,848 | 744,961 | 15.10% | 11.32% | 7.85% | 3.92% |
| Combined | 562,620 | 582,872 | 602,862 | 624,584 | 648,002 | 15.18% | 11.17% | 7.49% | 3.75% |
| Primary | 28,182 | 29,270 | 28,458 | 29,035 | 29,735 | 5.52% | 1.60% | 4.50% | 2.42% |
| Secondary | 42,816 | 43,591 | 44,722 | 46,451 | 47,397 | 11.96% | 9.97% | 7.19% | 3.20% |
| Special | 13,595 | 14,693 | 16,762 | 19,364 | 19,694 | 41.85% | 43.15% | 31.25% | 14.94% |
| Grand Total | 4,018,477 | 4,043,125 | 4,054,315 | 4,099,444 | 4,145,591 | 3.16% | 2.53% | 2.25% | 1.13% |
Australia wide, independent schools are showing an increase in enrolments of 15.10% from 2020 to 2024 when compared to the Grand Total student numbers which have only increased by 3.16% over the corresponding period.
I feel the biggest issue is the Government schools are not pulling their weight and have had an actual reduction in the numbers of students attending their schools.
No wonder we keep hearing the issue of Education in the budgets, as the various States ask for more money, yet continue to under deliver.
However, I would like to ask you to treat this minor detail with some care, because in my mind, the numbers are skewed a little towards Independent schools by two factors:
- In most states there are some large Islamic primary schools, and these schools offer low fees and compete more with the Government sector than the Independent sector, yet they are classified as Independent schools.
- Some schools that we would describe as Catholic schools (in my view) are represented in ACARA as Independent schools. Examples of this are the EREA schools in NSW, and schools like Loreto Kirribilli and St Aloysuis College which are shown as Independent.
The grass has been green for Independent schools over the last five years, but if we continue with harder economic times, and if the Government schools can improve their offers – can this continue?
Please contact us if you want to know how your state has changed over the years.
What does the future look like for your school?
While more children are having an Independent school education, can or will this continue? As the major cities are growing, many of the inner, higher socio-economic areas are forecast to reduce their populations, especially in school age children.
Have you considered how you will fare if the pendulum swings back towards Government schools, and if your area is going to experience a reduction in the numbers of school age children?
What actions should we be taking now to sure up our enrolments?
Suggestions:
- Understand (from mapping) where your current students, and your future enrolments are coming from.
- Use this information to have Major and Minor Trade Areas (probably covering around 90% of your students).
- Know what is happening in both the major and minor trade areas in terms of future school age children population forecasts.
- If you have a new, high growth area, should you market there and plan buses for the future?
- Understand the socio economics across your major and minor trade areas and look at market share by suburb that you achieve.
- Is your current transport systems (Public and School buses) covering the areas you need to cover for the future? Do you need a discussion with your bus company about the travel routes?
- Are you marketing into the right areas, and do you market into specific schools you know historically deliver students to you.
- If you run a primary school, do you know which kindergartens and childcare / pre-schools historically deliver children to your school, and do you market to them?
- What signage / bus shelters do you advertise in (and why).
Understanding and addressing these types of questions can only assist your marketing efforts and hopefully your future enrolments.
New Population Projections may not be as rosy as before!
Many areas that were expected to grow when the ABS (for the Department of Health) released their forecasts in 2019 have now proven to be heading in a different direction by the latest ABS forecasts released in October 2024, covering the period 2022 – 2032. Much of this population optimism is now an anticipated reduction, especially in school age children.
Over the last five years we have left behind the Covid threats and now are enduring a downturn in the economy across Australia. We are also experiencing changes to our migrant intakes, partly caused by Covid, and then by Government policy changes. Combine these with the average household size becoming smaller and a declining birthrate in Australia, and we have big changes in the demographic forecasts in localised areas.
There is no doubt that the lower cost outer metropolitan areas of most major cities are growing very fast. When we look at the areas around Marsden Park and Austral / Leppington in Sydney, and Wyndham, Clyde and Mickleham in Melbourne, these areas have been nominated to grow for some years now. The extent may change a bit but basically as our capital cities grow, and more houses are needed, these are the suburbs that people (especially migrants) are heading. There is a shortage of schools in these areas and alarming that there are few Independent schools looking to fill the gaps. There is opportunity, but the fees may not be very attractive.
What is more alarming from most independent school’s view is what is occurring in the higher socio-economic inner areas of the major cities, especially Melbourne and Sydney. Many of these areas are very high priced to buy into and have very little new housing as the existing houses and areas are relatively well protected by Councils against major demolitions or multi storied redevelopments. Older people are living longer and there is a government push to assist people to stay in their houses for as long as possible. This means less house turnovers and that when people can afford these houses, they are older and, in many cases, having older or less school age children.
Also mothers are having their first children at a later age, and the average family size has reduced so if they do move into the higher socio-economic areas, there are less preschool or school age children.
Here’s an example:
| School Age Population Projection from the ABS for Toorak (in Melbourne) Age 0-18 Population Projections | ||||
| Year | Age 0-4 | Age 5-11 | Age 12-18 | Age 5-18 |
| 2022 | 416 | 738 | 881 | 1,619 |
| 2023 | 401 | 742 | 910 | 1,652 |
| 2024 | 391 | 728 | 917 | 1,645 |
| 2025 | 383 | 711 | 925 | 1,636 |
| 2026 | 363 | 710 | 923 | 1,633 |
| 2027 | 339 | 703 | 924 | 1,626 |
| 2028 | 324 | 682 | 910 | 1,592 |
| 2029 | 308 | 666 | 904 | 1,570 |
| 2030 | 296 | 648 | 885 | 1,534 |
| 2031 | 285 | 623 | 876 | 1,499 |
| 2032 | 275 | 597 | 858 | 1,455 |
| 2033 | 264 | 571 | 844 | 1,415 |
| 2034 | 255 | 547 | 828 | 1,375 |
| 2035 | 244 | 523 | 813 | 1,336 |
| 2036 | 234 | 500 | 796 | 1,296 |
| 2037 | 224 | 477 | 779 | 1,256 |
| Growth 22-32 (#) | -141 persons | -141 persons | -23 persons | -164 persons |
| Growth 22-32 (%) | -33.8% | -19.1% | -2.6% | -10.1% |
| Growth 22-37 (#) | -192 persons | -261 persons | -102 persons | -363 persons |
| Growth 22-37 (%) | -46% | -35.3% | -11.6% | -22.4% |
Source: – ABS population data to 2022 – 2032, and then extrapolation using the changes from 2030 – 2032 to extend out to 2037.
This is showing a forecast drop in the number of school age children (5 – 18 year olds) over the next 15 years of around 22%.
When we look at maps of Melbourne and Sydney, we should recognise the areas of highest decline (the brown areas) are many of our highest socio-economic suburbs.
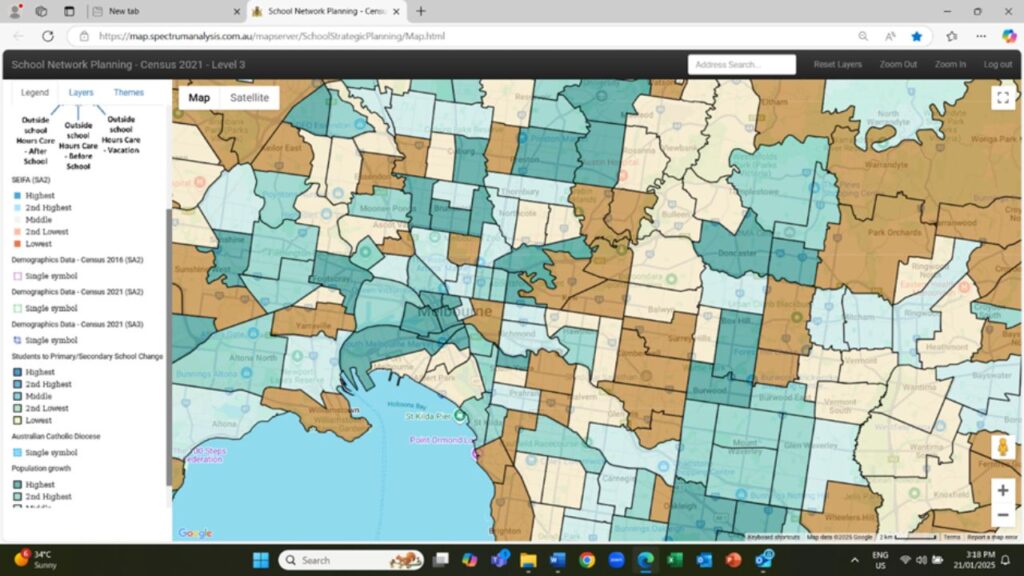
Map of inner Melbourne showing areas of decreasing student population (in brown).
We see very similar in Sydney for areas like Mosman, Mona Vale, Concord and Rose Bay.
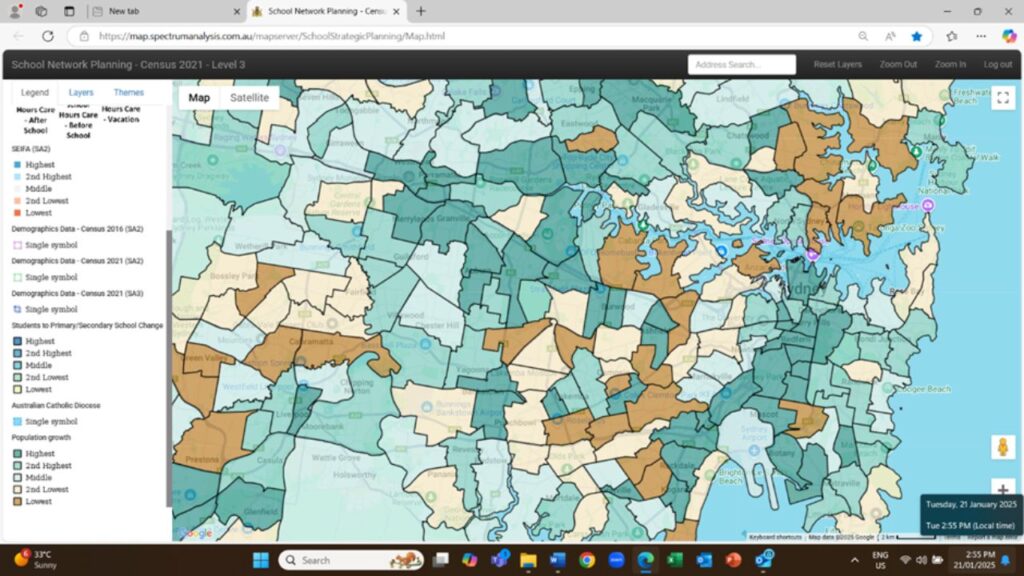
Map of inner Sydney showing areas of decreasing student population (in brown).
Most of our major Independent and Catholic schools are within the inner suburbs of Melbourne and Sydney, and these areas are forecast to reduce the student age population. If you expect to remain at the same numbers over time, the logic is that you will need to attract more students from further away, preferably using buses or public transport, take students from other schools or convert more students from attending Government schools to the Independent or Catholic school systems.
Action Plans
If your school is stable or improving slowly in enrolments, you are doing reasonably well if you are in a medium to higher socio-economic area. The best test is the length of the waiting list for your school, and if this is reducing, there could be a major problem coming. Maybe you just need to know what is coming in terms of population forecasts, and you may be managing it very well by your school’s reputation and past performance.
If your numbers are dropping, then you need to see what is happening with your major competitors and see what the demographic forecasts are for your Trade Area. Maybe recognising that students may need to travel further in the future can assist with improved bus runs, improved school drop off points or some other minor actions that make it easier for students to reach your school.
If you are experiencing an enrolments slide, then drastic action is required as it is very hard to reduce your fixed costs (wages etc) without feeling the effects in the classroom.
If you need assistance in securing the data and analysing it so you can have a data-based action plan, please contact us to discuss how we can help you further.