School Reports – but not as you expect them!
Demographics should be essential in your decision-making process.
Peter Buckingham BSc, GradDip (Market Modelling), CMC, CFE, FFCA, MEdPlus, WFA, ACAVic is a Demographer and the Co-Founder and Managing Director of Spectrum Analysis Australia Pty Ltd, the leading demographic analysis and mapping company for schools in Australia. He was also a Federal Director and Victoria / Tasmania President of the Institute of Management Consultants. Peter is contactable by email at: peterb@spectrumanalysis.com.au or visit spectrumanalysis.com.au.
When we hear the words ‘school reports’ all we normally think of is seeing the teachers (with your parents) and then finding out how well (or poorly) you have done according to the teacher’s view.
There are other types of ‘school reports’ that become very important when your school is planning any strategic change including:
- opening a new campus
- purchasing land
- adding to or changing your school offerings (e.g. an Early Learning Centre)
- undertaking major capital works.
The type of school reports I am referring to are the ones a Principal, the School Executive and the Board need to consider for the future of the school.
These could be called ‘School Demographic and Competition Reports,’ to give you a clear understanding (and hopefully confidence) in making major strategic decisions for your school.
Many of the School Demographic and Competition Reports we do are related to looking at:
- Where to locate a new campus (aligned with attractive student populations)
- Whether to extend the school and buy land and / or add new buildings on what we have
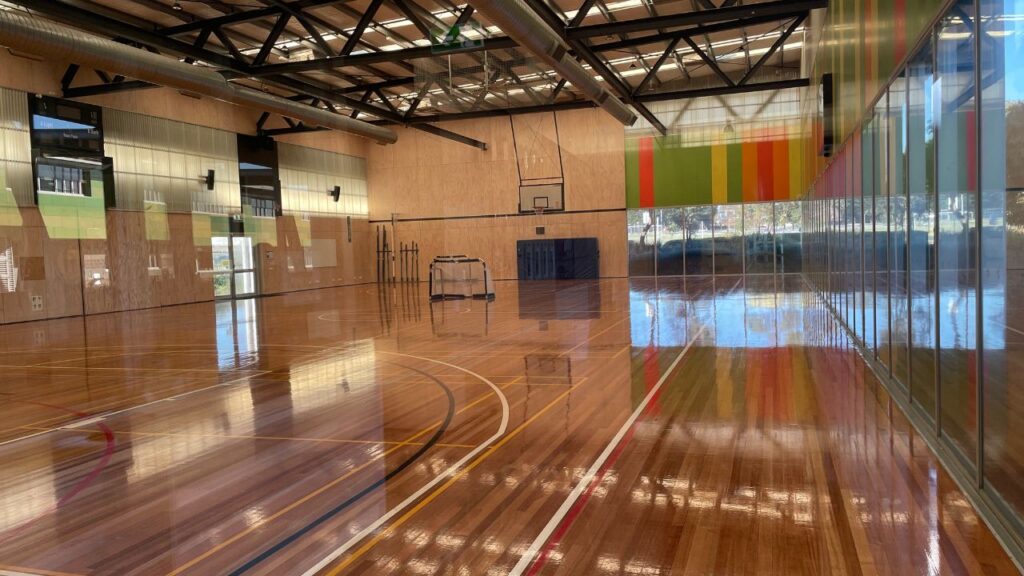
- Considering adding or expanding a major feature of the school – sports centre, performance hall, library etc.
- Where to concentrate our marketing in the future
- Staying viable and continuing into the future or consider other options like going co-educational
- Providing information to lenders (banks or other financial institutions) or Block Grant’s Authorities across Australia about your new projects.
What information should we be considering?
Like Supply and Demand modelling, the first area we normally address is the current and forecast population of school age children. This starts with data provided by the Australian Bureau of Statistics and looks at current student age numbers, and what these are projected to do out to 2032 (at present).
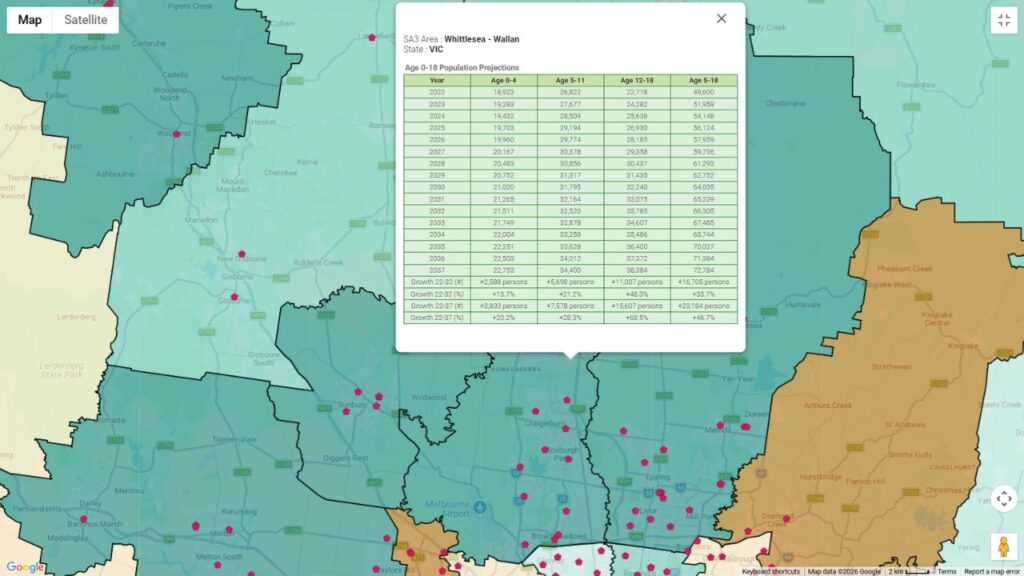
Obviously if the area is growing in student numbers, then additional school places are probably required. High growth areas are normally the developing pockets of our major capital cities where younger people are building new houses. Areas like Craigieburn, Whittlesea and Clyde in Melbourne and Marsden Park and Leppington in Sydney.
- SA2 Area : Whittlesea
- State : VIC
| Age 0-18 Population Projections – Table of population forecasts by age for the Whittlesea area | ||||
| Year | Age 0-4 | Age 5-11 | Age 12-18 | Age 5-18 |
| 2022 | 904 | 1,201 | 1,109 | 2,310 |
| 2023 | 1,074 | 1,459 | 1,287 | 2,746 |
| 2024 | 1,228 | 1,730 | 1,495 | 3,225 |
| 2025 | 1,385 | 2,000 | 1,702 | 3,702 |
| 2026 | 1,529 | 2,293 | 1,919 | 4,212 |
| 2027 | 1,638 | 2,619 | 2,160 | 4,779 |
| 2028 | 1,811 | 2,870 | 2,421 | 5,291 |
| 2029 | 1,971 | 3,117 | 2,692 | 5,809 |
| 2030 | 2,123 | 3,358 | 2,944 | 6,302 |
| 2031 | 2,264 | 3,582 | 3,224 | 6,806 |
| 2032 | 2,398 | 3,784 | 3,513 | 7,297 |
| 2033 | 2,543 | 4,009 | 3,829 | 7,837 |
| 2034 | 2,696 | 4,248 | 4,172 | 8,420 |
| 2035 | 2,852 | 4,493 | 4,537 | 9,030 |
| 2036 | 3,015 | 4,750 | 4,931 | 9,681 |
| 2037 | 3,182 | 5,014 | 5,351 | 10,365 |
| Growth 22-32 (#) | +1,494 persons | +2,582 persons | +2,404 persons | +4,987 persons |
| Growth 22-32 (%) | +165.1% | +214.8% | +216.6% | +215.8% |
| Growth 22-37 (#) | +2,278 persons | +3,813 persons | +4,242 persons | +8,055 persons |
| Growth 22-37 (%) | +251.7% | +317.1% | +382.2% | +348.5% |
What you then need to consider is what are the socio demographics of these areas, and what will be their ability to pay for a reasonable education?
Whether we look at Average Household Income, or SEIFA (Socio Economic Index for Areas) we have ways of comparing and deducing the potential fees.
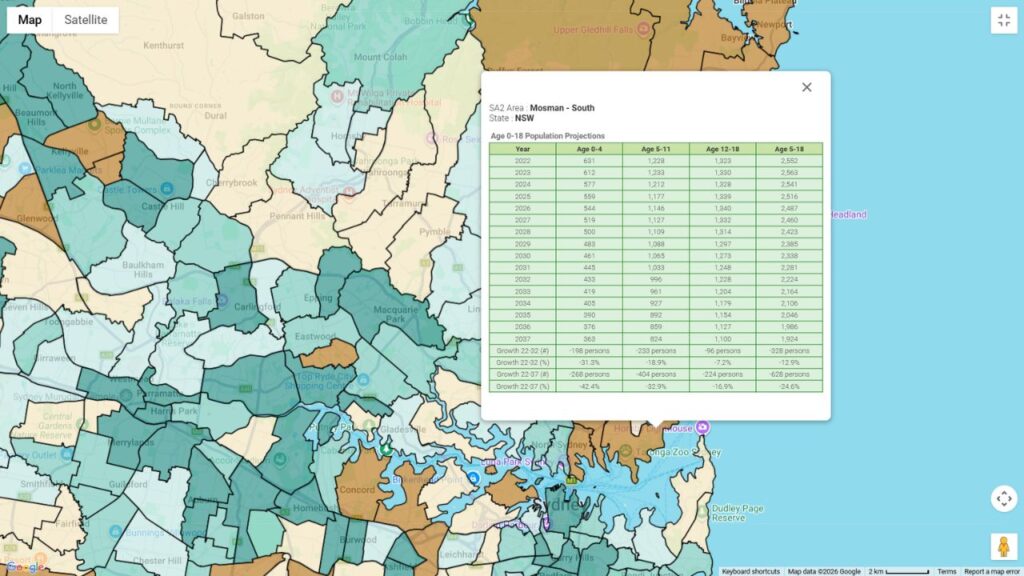
The opposite to this is high socio-economic areas where in many cases the school age children’s numbers are reducing, and in some areas this can be as high as 10% in the next 8 – 10 years.
Suburbs like Toorak and Double Bay are typical of this, and the Sydney and Perth suburbs are even more effected as they are often bordered by water on two or three sides making it even harder for pupils to attend if they do not live nearby.
- SA2 Area : Mosman – South
- State : NSW
| Age 0-18 Population Projections – Table of population forecasts by age for the Mosman – South area | ||||
| Year | Age 0-4 | Age 5-11 | Age 12-18 | Age 5-18 |
| 2022 | 631 | 1,228 | 1,323 | 2,552 |
| 2023 | 612 | 1,233 | 1,330 | 2,563 |
| 2024 | 577 | 1,212 | 1,328 | 2,541 |
| 2025 | 559 | 1,177 | 1,339 | 2,516 |
| 2026 | 544 | 1,146 | 1,340 | 2,487 |
| 2027 | 519 | 1,127 | 1,332 | 2,460 |
| 2028 | 500 | 1,109 | 1,314 | 2,423 |
| 2029 | 483 | 1,088 | 1,297 | 2,385 |
| 2030 | 461 | 1,065 | 1,273 | 2,338 |
| 2031 | 445 | 1,033 | 1,248 | 2,281 |
| 2032 | 433 | 996 | 1,228 | 2,224 |
| 2033 | 419 | 961 | 1,204 | 2,164 |
| 2034 | 405 | 927 | 1,179 | 2,106 |
| 2035 | 390 | 892 | 1,154 | 2,046 |
| 2036 | 376 | 859 | 1,127 | 1,986 |
| 2037 | 363 | 824 | 1,100 | 1,924 |
| Growth 22-32 (#) | -198 persons | -233 persons | -96 persons | -328 persons |
| Growth 22-32 (%) | -31.3% | -18.9% | -7.2% | -12.9% |
| Growth 22-37 (#) | -268 persons | -404 persons | -224 persons | -628 persons |
| Growth 22-37 (%) | -42.4% | -32.9% | -16.9% | -24.6% |
The competition is also a major factor if you think in terms of supply and demand. If the competitive schools are doing very well, steady growth according to the ACARA numbers, then it may be very hard to achieve a quantum increase in students, no matter how you develop your school.
Areas of very high competition like the Kew / Hawthorn schools in Melbourne and the Eastern suburbs of Sydney and the area surrounding Claremont and Mosman Park in Perth all have long established great schools, competing for a decreasing number of local students.
School Demographic and Competition Reports
Depending on the issue at hand, we formulate the report to answer the questions asked of us by the school and provide an independent report for your further evaluation or action.
Below is a sample of a Table of Contents from a recent report for a school.
TABLE OF CONTENTS
1. Executive Summary
2. Introduction
3. Demographic changes in Your Trade Area
4. Methodology + Data
5. Summary and Recommendations
Appendix 1
– 2025 enrolment data of Target School
Appendix 2
– Map and demographic summaries from Census 2021 for 3, 5 and 10kms around Target School and the nominated Trade Area
Appendix 3
– Map of SA2s and demographic summaries
Appendix 4
– Map of SA3s and demographic summaries
Appendix 5
– Population forecasts by age group for your Trade Area
Appendix 6
– Map of Competition and enrolment data
Appendix 7
– Description of Socio-Economic Index for Areas (SEIFA)
Appendix 8
– Socio-Economic Index for Areas (SEIFA) Map
Board Reports
On some occasions we are asked to prepare a special report for the Board and in many cases deliver the report and address any questions. These are normally done as a PowerPoint report so school executives may choose to handle the delivery, or else we can do this in person or via Zoom.
This can include addressing Strategy Days run by the Board with a full report on current situations as they affect schools, down to individual school issues such as marketing, bus routes and future growth.
Addressing ELC issues
Many schools are looking at opening an Early Learning Centre ELC to support the community and give themselves a better chance to fill their Prep year and even attract students back to the school in Year 7.
If you are looking to do an ELC, you need to understand the change in population forecasts for 0 – 4 year olds, and what the local community is seeking – whether it is basically child-minding services or Early Learning and a more formal pre-school program to set the child up better for their Prep year. We understand this is a moving target, especially as Governments keep altering the funding models.
In any area we can access the ACECQA data which tells us how many Approved Places there are at every child care centre in Australia and from that we can see the ratios of children aged 0 – 4 compared to number of approved places for that area.
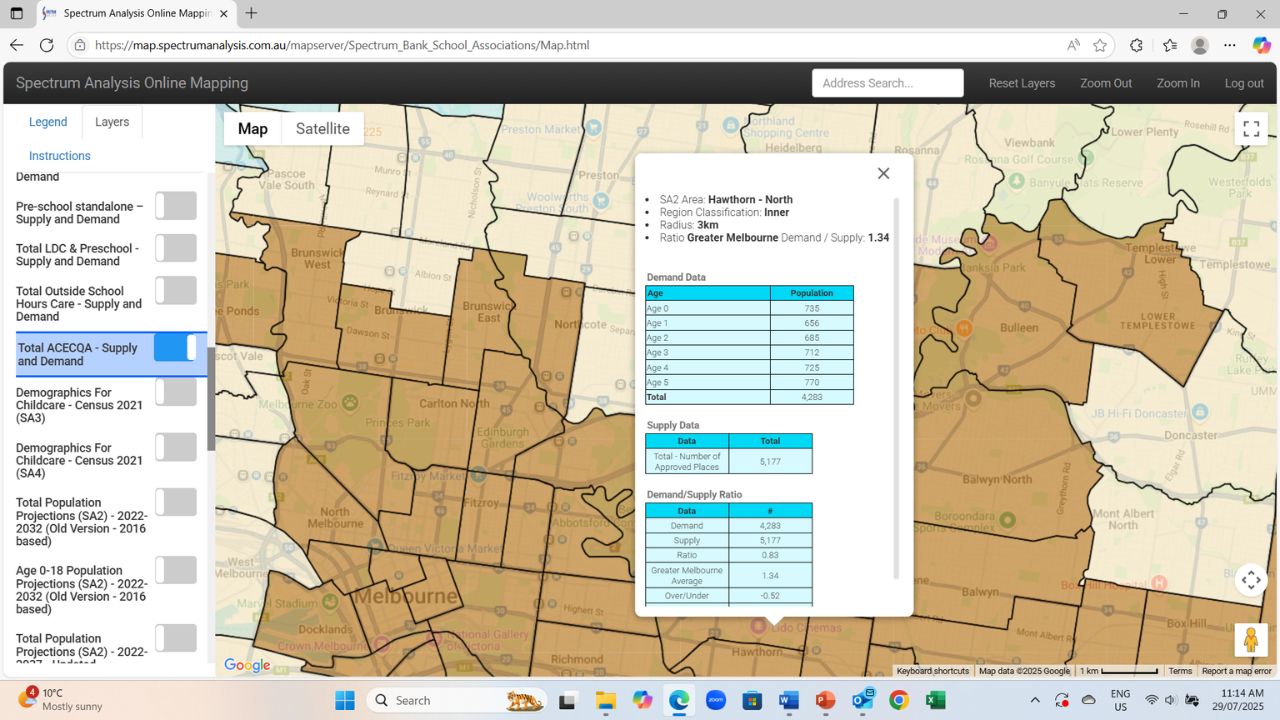
Map showing the ACECQA Childcare numbers and the child population for Hawthorn – North
The socio demographics can also have an influence as we look to what is the parents’ needs and expectations for the early learning of their children.
Summary
If you have an issue and need an expert report to assist you in making major decisions for your school, these are available through Spectrum Analysis.
We would be happy to discuss any situations in a confidential manner and assess what the needs are and how we can best address them to help you make evidence-based decisions.
Contact me directly on peterb@spectrumanalysis.com.au or +61 411 604 921 for a quick chat…
Details:
Download a free eBook, our brochure, gain access to sample reports and online mapping etc. for Schools, Colleges and Universities online at
https://spectrumanalysis.com.au/services/education-analysis
Download a free eBook, our brochure, gain access to sample reports and online mapping etc. for Early Learning Centres online at
https://spectrumanalysis.com.au/services/early-years-education-centres
See future and past events hosted by Spectrum Analysis on our Presentations page at https://spectrumanalysis.com.au/resources/presentations
Other articles that may also be of interest
White Paper Future Student Population Trends By Peter Buckingham
Catholic Development Network Changing Student Populations Webinar
Hope is not a strategy in 2026
Social Media Shares:
Archive.org
Facebook Spectrum Analysis
Google Profile Peter Buckingham
Google Profile Spectrum Analysis Australia
LinkedIn Peter Buckingham
LinkedIn Spectrum Analysis
Twitter / X Spectrum Analysis