Education Analysis

Demographic Analysis, Enrolments, Marketing, News for Schools, Colleges and Universities

It’s all about the future.

Schools, Colleges and Universities Education Analysis Services

Strategic planning, enrolments, alumni, marketing, community development reports for Early Learning Centres (including Kindergartens, Pre Schools and Child Care), Schools, Colleges and Universities.

Strategic Planning

Are you responsible for collecting information for strategic planning decision-making in early learning, schools, colleges or universities?

Executive level decision-making requires reliable, quantitative data to ensure it meets governance, risk and statutory authority compliance requirements.

Whether you are the Principal, Vice Chancellor or a Manager leading the Business, Enrolments, Marketing or Alumni area of the Early Learning, School, College or University, you need to understand the demographics of your current, future and past students and other factors affecting your expenses and grants funding.

Quality demographic information can affect several strategic planning decisions. You need facts and data across multiple areas.

Spectrum Analysis has been working with a variety of Early Learning, Independent, Catholic and other Non-government Schools, Colleges and Universities since 2009.

We can:

  • complete a comprehensive student demographic analysis and produce demographic mapping for various characteristics including: where students live; their age, ethnicity, religious affiliation, household income, individual income; the level of student penetration by area; demographics around the Early Learning Centre, School, College or University; future growth predictions by age groups, mapping of other Early Learning, Schools, Colleges and Universities nearby; mapping public transport routes etc
  • explore multiple enrolment strategies based on student locations, affordability of school fees and access to various forms of transport
  • explore multiple marketing strategies for location based advertisements, canvassing aligned feeder schools and understanding your competition
  • design effective alumni outreach strategies worldwide
  • verify the financial viability of large investments in education, capital improvements, new buildings, new campuses and school mergers
  • extract your school’s unique Socio-Economic Status (SES) score based on your student addresses and Department of Education, Skills and Employment data and display the SES scores for your school area and where your students are from
  • look at specific areas of concern related to your early learning centre, school, college or university including curriculum development, class allocations or academic achievement (for example, you may have a high proportion of students with a non-English speaking background and need additional English as a Second Language classes)

We can provide thermatic layer maps (darker and lighter colours across variables) with overlays for bus routes and competitors.

Student Demographic Analysis and Mapping

Do you have a clear picture of where your students come from to attend your early learning centre, school, college or university and do you understand their demographics?

At Spectrum Analysis, we can:

  • collect data and analyse your residential demographics so you can understand exactly who your students are and where they come from
  • design target marketing strategies for specifc demographics to improve your marketing efficiency
  • identify where you can expand your enrolment base to maximise your return on marketing activity
  • define primary and secondary marketing areas and identify areas for expansion

We can:

  • map all student addresses and compare this with the latest Australian Bureau of Statistics (ABS) Census to see the areas of high and low student penetration and high and low student spend
  • identify the students who live in every Statistical Area Level One (SA1) – there are approximately 57,000 Statistical Area Levels across Australia
  • identify all students on a map area by various classifications including male or female, attending primary or secondary school and whether they are schooled in Government, Independent, Catholic or other Non-government schools
  • demonstrate how your school, college or university is performing in any area (at SA1, suburb or postcode level) and identify any areas or under or over representation
  • show where your primary catchment areas are and future secondary catchment areas could be
  • the Australian Bureau of Statistics (ABS) data we use provides population data for the next five, 10 or 15 years (very useful for specific analysis)
  • the ABS data also includes building permit data which helps identify population forecasts and areas of new housing development
  • understanding the population forecasts and the socio-economics of surrounding suburbs can identify new market opportunities over the long term
  • review the demographics of students from feeder early learning centres, schools, colleges and universities
  • prepare affordability assessments for an area so you can design equitable early learning centre, school, college or university fees
  • provide facts and data for grant applications, particularly useful in low socio-economic areas or areas with specific community challenges

GeoMapping Plus via Somerset Education Portal

Are you from one of more than 600 Australian Independent, Catholic or other schools that has provided school financial data to the Somerset Education Survey established in 1993?

John Somerset FCA, the Founder of Somerset Education, is dedicated to the financial viability and sustainability of Non-government schools and he is a leader in this field. 

In March 2020, Spectrum Analysis and Somerset Education announced an alliance that gives schools access to GeoMapping Plus via the Somerset Education Portal Survey Login.

The Somerset Education website allows both existing Somerset Education clients and survey contributors access to free online resources and the ability to subscribe to GeoMapping Plus.

GeoMapping Plus allows you to map your current students, future students, alumni and bus routes online at any time. More comprehensive data and analysis is available on request.

Access GeoMapping Plus via the Somerset Education Portal here.

Click here to download the Spectrum Analysis and Somerset Education GeoMapping Plus User Guide.

The video below provides a brief introduction to GeoMapping Plus.

Enrolment Marketing and Management Strategies

Are you responsible for ensuring that there is a steady stream of enrolments for your early learning centre, school, college or university both now and in the future?

If you are fully aware of the strengths and weaknesses of your early learning centre, school, college or university, based on facts and data, you can identify effective enrolment marketing and management strategies.

We can:

  • assess the individual viability of different offline enrolment strategies and the best locations for each strategy
  • compare your enrolment strategy options with the options of your major competitors and where possible, not compete in the same location
  • find more potential sources of future students up to postgraduate level
  • identify areas of similar demographics
  • identify safe and convenient ways for students to travel to and from school, college or university across all age levels via public transport and/or private bus routes either in the local area or to and from a transport hub (bus, train or tram)
  • ensure existing transport options are the most efficient or if they need some adjustment as the centre of the student population may have shifted over time

Marketing and Community Relations Strategies

Are you responsible for marketing or community relations for your early learning centre, school, college or university?

Many early learning centres, schools, colleges and universities still use a variety of traditional marketing and community relations strategies including:

  • billboard advertising
  • bus, train and tram advertising
  • transport platform and bus shelter advertising
  • building relationships with aligned local feeder early learning centres, schools, colleges and universities
  • radio, television and cinema advertising
  • public events and activities for local communities
  • open days and activities with other non-competing early learning centres, schools, colleges and universities (like school visits for potential future students)
  • shared resourcing of buildings, grounds, theatres, swimming pools and sports stadiums

We can:

  • identify the best locations for any visual representation of your early learning centre, school, college or university
  • identify the best schools, colleges or universities to engage with to meet your short and long term objectives
  • target your time and budget to the most promising locations
  • ensure that your marketing content reaches the decision-makers that are demographically and statistically inclined to enrol a student in your early learning centre, school, college or university
  • assess your existing strategy, test a future strategy or co-design a new strategy that provides a way to increase enrolments, return on investment (ROI) and marketing efficiency

Alumni Relations Strategies

Are you responsible for finding and engaging with alumni from around the area or around the world?

Would you like to have your alumni locations plotted on a map so that you can identify where to host in-person activities suited to the highest density of alumni from your early learning centre, school, college or university? Or select which alumni may be able to engage with your virtually from remote locations across the globe?

We can:

  • map all former student addresses (where they live or work) and then compare this data with your existing alumni relations strategies
  • identify where your alumni referrals are coming from and incorporate this in your enrolment, marketing and community relations strategies
  • provide research on where to find and engage with fundraising prospects and map your financial supporters
  • create alumni penetration reports for specific goals (mentoring, event attendances, donations)
  • review your current and lapsed donors, where they live and what demographics they represent 
  • import tailored data for more comprehensive analysis and modelling for your specific goals and objectives (for developing reports for boards and alumni groups)
  • identify clusters of alumni that can be contacted for potential mentoring progams, in-person guest speaking opportunities, online video interviews, alumni networking, reunion organisation or voluntary or financial philanthropy
  • referrals to other alumni relations specialists and providers

Reviews and Testimonials

Dr Paul Hicks, Headmaster
Dr Paul Hicks, HeadmasterCamberwell Grammar School
‘I am pleased to commend their work to you. In a competitive market, information is a vital tool. Spectrum Analysis was able to give us detailed data and insightful analysis, which we have been able to incorporate into our strategic planning. We have found the service from Spectrum to be excellent – the data presented in a variety of ways and their maps particularly helpful. I have no hesitation in recommending Peter Buckingham and Spectrum Analysis to any organisation seeking deeper understanding of the demographics of their business.’
Sarah Ryan, Chief Marketing Officer
Sarah Ryan, Chief Marketing OfficerLoreto Normanhurst
'A sincere thank you for the support you and your team have provided to Loreto Normanhurst. The Spectrum Analysis tools have allowed us to approach our enrolments with greater focus. The mapping tool has informed the development and targeting of advertising campaigns, the location of events, and review of our bus routes. It has been a game changer to underpin our plans with the data-based insights that Spectrum Analysis has helped to unlock. I am happy to recommend Spectrum Analysis to any school looking to step change their strategy and the return on investment for their precious people and financial resources.’
Tammy Wilson, Director of Advancement
Tammy Wilson, Director of AdvancementToowoomba Grammar School
'Toowoomba Grammar School commenced working with Spectrum Analysis in 2021. Their demographic data and mapping tools have assisted us in analysing data pertaining to our past, present and future enrolments. Given the highly competitive nature of school enrolments and finite school marketing and enrolment budgets, this data is helping our decision making processes for enrolment and marketing strategies. Knowing that the Spectrum Analysis data is backed by ABS data gives us great decision making confidence. Peter, Dorianne and the team are all knowledgeable about the education sector and the need for data driven decision making. They have also made setting up our TGS reporting very easy. I highly recommend Spectrum Analysis to other organisations looking to further enhance their strategic operations.'
Martin Gooding, Head of Enrolments
Martin Gooding, Head of EnrolmentsKnox Grammar School
Knox Grammar School first commissioned Peter Buckingham and the team at Spectrum Analysis in 2016, to provide demographic and other information pertinent to the past, present and future enrolment communities at the School. Since that time, we have commissioned updates and further studies, most recently this year. In a rapidly changing demographic landscape, and in a highly competitive education environment, it is crucial to understand where, and from whom, enrolments originate, and will originate, in order for informed decisions on planning and strategy, to take place. In that respect, we have found the reports, and the manner in which they are provided, extremely informative and helpful. Peter and his team demonstrate an awareness of the education landscape, and the needs of our school, and exhibit this both in their reports, and in their personal interactions with us. I have no hesitation in recommending Peter and Spectrum Analysis.
Matt Easdown, Director of Business Services
Matt Easdown, Director of Business ServicesSt Joseph's College (Joeys) Hunters Hill
St Joseph's College has been using the services of Peter Buckingham and the team at Spectrum Analysis for several years. I recommend their services to you. They have always been responsive to our requests and have provided exceptionally good customer service with a quality demographic data analysis product. The reports and mapping tools enable us to critically look at our enrolment data and develop strategies for future planning in relation to our enrolments and marketing strategy. The process of providing data and feedback from the team at Spectrum Analysis has been very efficient and they have responded positively to our requests for additional analysis and data. I have no hesitation in recommending Spectrum Analysis to other schools and organisations interested in understanding their markets and demographics.
Bruce Rixon, Principal
Bruce Rixon, PrincipalMalek Fahd Islamic School
Malek Fahd Islamic School recently commissioned a demographic report from Peter Buckingham and Spectrum Analysis, and I would gladly recommend their service to any organisation. Spectrum provided a very professional and efficient service. The report presented was detailed and extremely helpful in the development of the School's Strategic Plan. I recommend them to any school interested in ensuring they plan effectively to cater for possible enrolment opportunities.
Mark Robertson, Principal
Mark Robertson, PrincipalOakleigh Grammar School
Recently Oakleigh Grammar commissioned the services of Spectrum and their team lead by Peter Buckingham. Tracking and analysis tools are essential resources within the highly competitive market of Independent School enrolments. Both our Executive Leadership and Admissions Teams have found the Spectrum Analysis data, specific and tailored to our School, to be integral to our strategic planning and management. I have no hesitation in recommending the services of Peter and his team at Spectrum to any organisation seeking a deeper understanding of the demographics of their business.

Security Policies

Here at Spectrum Analysis, we meet strict security protocols to ensure all of our data, paid subscription data and client data is kept in a secure and safe environment in Australia. You can learn more about our security policies here.

Strategy News for Schools Email Newsletter

Would you like to be kept up to date with the latest information on demographics, analysis, mapping, enrolments, marketing, community relations, alumni relations and online strategy?

In October 2019, Spectrum Analysis started producing a free email newsletter with practical information for Early Learning Centres, Schools, College and Universities.

You can subscribe to the Strategy News for Schools email newsletter and see past editions here.

Frequently Asked Questions FAQ's

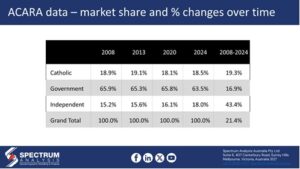
Students in Australia usually go to either Government Public Schools, Catholic Schools or Independent Schools. From 2020 to 2024, there has been a 15.1% increase in the numbers of students going to Independent schools compared to the other two classifications. Total student numbers have increased by 3.16% in the same period and Government schools have decreased by 0.43% in the same period.

In Australia we have the Australian Curriculum, Assessment and Reporting Authority (ACARA) data. This is freely available and tells us how many enrolments there are at over 9,000 schools across Australia. The ACARA data starts in 2008 and is based on an audit of student numbers each school has to submit in October every year. The ACARA data also gives the numbers of teaching and non-teaching staff for each school, and you can derive the number of pupils per teacher as a way of comparing schools. At Spectrum Analysis, we have added this data to our online mapping so you can scroll over any school and see the figures.

In 2024, 63.5% of all students went to Government Schools, 18.5% of all students went to Catholic Schools and 18.0% of all students went to Independent Schools.

ACARA Data for Schools By Peter Buckingham at Spectrum Analysis Australia

The Australian Bureau of Statistics (ABS) produces Population Forecast numbers each five years by gender and age group. The latest information was released in October 2024 following the 2021 Census of Population and Housing in Australia and covers the period 2022 – 2032. The data is in groupings of ages 0 – 4, 5 – 9, 10 – 14, 15 – 19 years old etc. These can be cut to estimate 0 – 4 years old (pre-school), 5 – 11 (Primary school) & 12 – 18 (Secondary School) estimates. You can see how many students should be available for each area, and if this number is forecast to increase or decrease over the next 7 years. Many inner city, high socio-economic areas in capital cities across Australia are seeing declining student age populations. This is likely to have an impact on Independent school student numbers over the next 10 years or so and it could mean that Independent schools will need to revisit their strategic plan for securing ongoing enrolments.

All areas are different! We completed some research in 2025 using data from 16 campuses in inner Melbourne and came to the conclusion that 50% of pupils came from within a 4.0 km radius of their school and around 12% came from over 10 kms from the school.

0

1km

2km

3km

4km

5km

6km

7km

8km

9km

10km

> 10 km


9.3%

23.8%

37.3%

50.2%

62.5%

71.4%

77.7%

82.0%

85.5%

88.1%

11.9%

We did a similar project for schools in outer Melbourne suburbs and concluded 50% of students came from within a 5.5km radius and 23.6% came from over 10 kms from the school.


0

1km

2km

3km

4km

5km

6km

7km

8km

9km

10km

> 10 km


7.7%

16.5%

27.6%

37.8%

47.3%

53.3%

58.9%

64.9%

71.3%

76.4%

23.6%

This is very important to consider when doing location-based marketing to ensure you get the best value for your spend, especially with social media advertising and above the line products like billboards and bus signage.

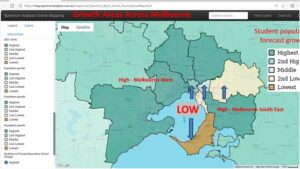
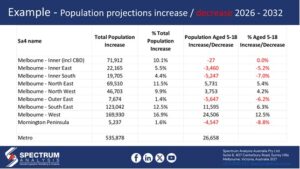
Spectrum Analysis is able to assist schools across Australia to help them find out what areas are growing in student numbers and what areas are declining. Here in Melbourne, using Statistical Area’s 4 (SA4’s), the biggest forecast growth areas in Melbourne are the outer West, and outer Southeast. In terms of decline in student numbers, the Mornington Peninsula area is forecast to decrease the most. The other declining areas are the inner East, inner South and outer East (areas of statistically more older residents past child-rearing years).

Australian Bureau of Statistics Population Forecasts Growth Areas across Melbourne By Peter Buckingham at Spectrum Analysis Australia Australian Bureau of Statistics Population Increase or Decrease Areas across Melbourne By Peter Buckingham at Spectrum Analysis Australia


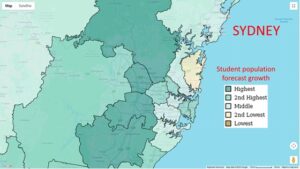
Spectrum Analysis can assist schools across Australia to help them find out what areas are growing in student numbers and what areas are declining. In Sydney, the areas of largest growth are the outer areas in the Northwest, West, and Southwest. Areas around Blacktown and Marsden Park in the Northwest and around Leppington and Narellan in the Southwest are very high growth zones. The area of major reduction in Sydney will be the Northern Beaches, from Manly to Avalon as these districts age and are very expensive for younger people to buy into.

Australian Bureau of Statistics Population Forecasts Growth Areas across Sydney By Peter Buckingham at Spectrum Analysis Australia


The effect has been to force up fees as schools try to recover this unexpected cost from parents via fee increases. Some schools have tried to absorb it and have taken action like increasing class sizes. Overall, we have seen fee increases of around 6% across the higher fee Independent schools from 2024 to 2025.

The population forecast information is normally released at Statistical Area 2 (SA2) level. This is roughly equivalent to the size of a postcode area.

The Spectrum Analysis’ GeoMapping Plus online demographic mapping product can be licenced for a school to use. It includes ACARA data, Census data, total population projection data, population projection data for school age children, ACECQA data for childcare centres, SEIFA data, religion information and more. This can be tailored to a school and include student data and bus route information as well.
We welcome your enquiry!

Spectrum Analysis can tailor a demographic mapping analysis and report that covers all of the major items a school needs to address including  strategic planning, future enrolment forecasting, bus routing, understanding competition, grant application data etc. and all of the information seen as essential for making evidence-based decisions for a school at Board and Senior Executive level to help the school’s future.

Spectrum Analysis prepares demographic mapping reports for use at Board level and senior executive levels to help make evidence-based decisions on proposed new school sites. These reports can also be provided for government funding applications and to banks and other finance lenders.

Absolutely! Peter Buckingham is happy to speak to you directly via +61 411 604 921 or you can email peterb [at] spectrumanalysis.com.au to schedule a chat!